Step 1

Discover
- We visit and map one process end to end
- You see screens, data flows and hardware plans
- A written proposal with a clear price for the pilot
Machine monitoring, digital job cards and carbon data for factories and production lines.
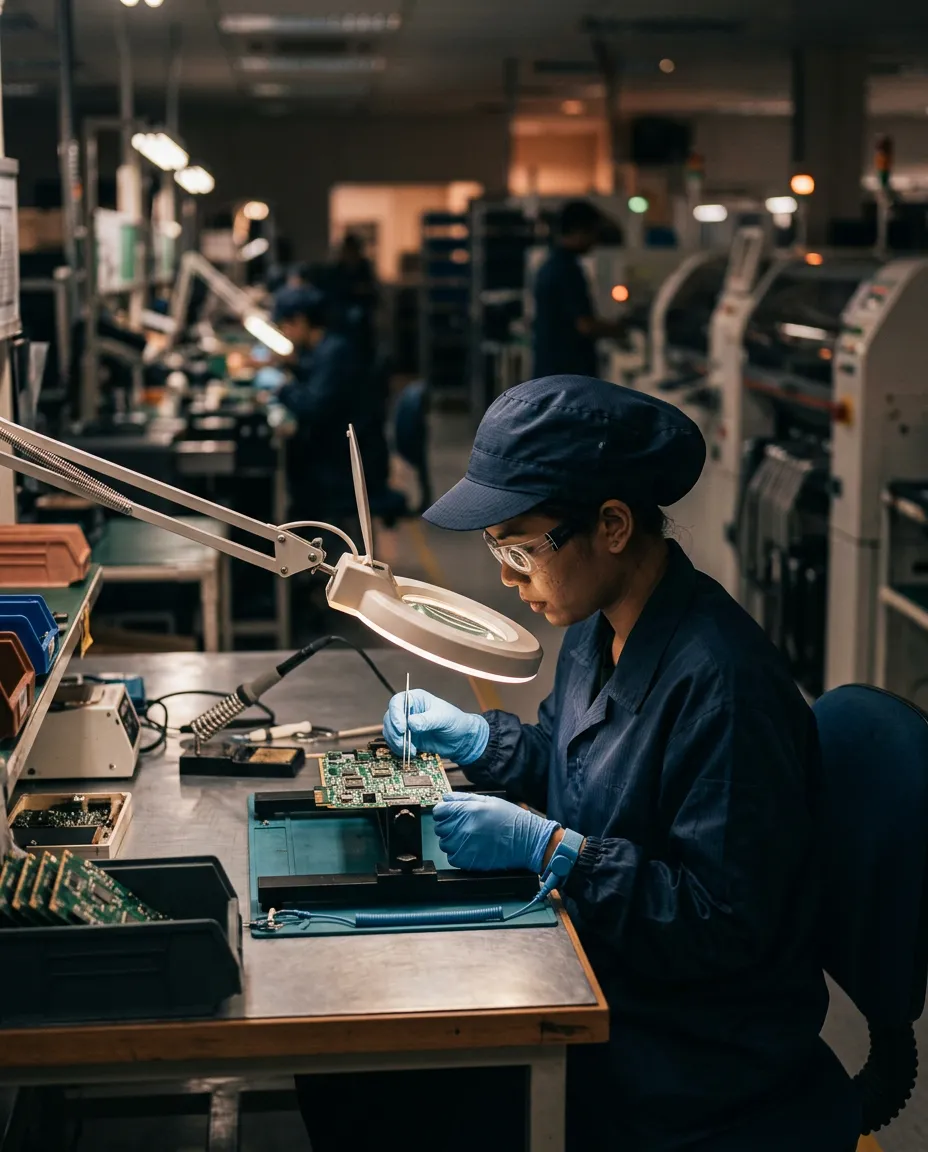
Example systemIoT monitoring
Downtime is noticed at the end of the shift, not when the machine stops.
Delayed reporting
Job cards, checklists and logs are filled in on paper and typed up later.
Paper-based, manual processes
Customers ask for energy and carbon figures you have no easy way to measure.
Data that isn't kept or used
Planning, production and quality each keep their own spreadsheets.
Siloed systems
Retrofit sensors on existing machines to track status, output and downtime live.
Learn IoT monitoringOperators log work on tablets; supervisors approve and output reports build themselves.
Learn DigitalisationIncoming delivery orders and invoices are read and matched against purchase orders.
Learn AI & automationSub-metering that feeds carbon-per-product figures for customer ESG questionnaires.
Learn ESG & energyEvery project begins with one process, so you see results before you commit to more.
Step 1
Step 2

Step 3