Measure energy and carbon from the meter up, not from estimates.
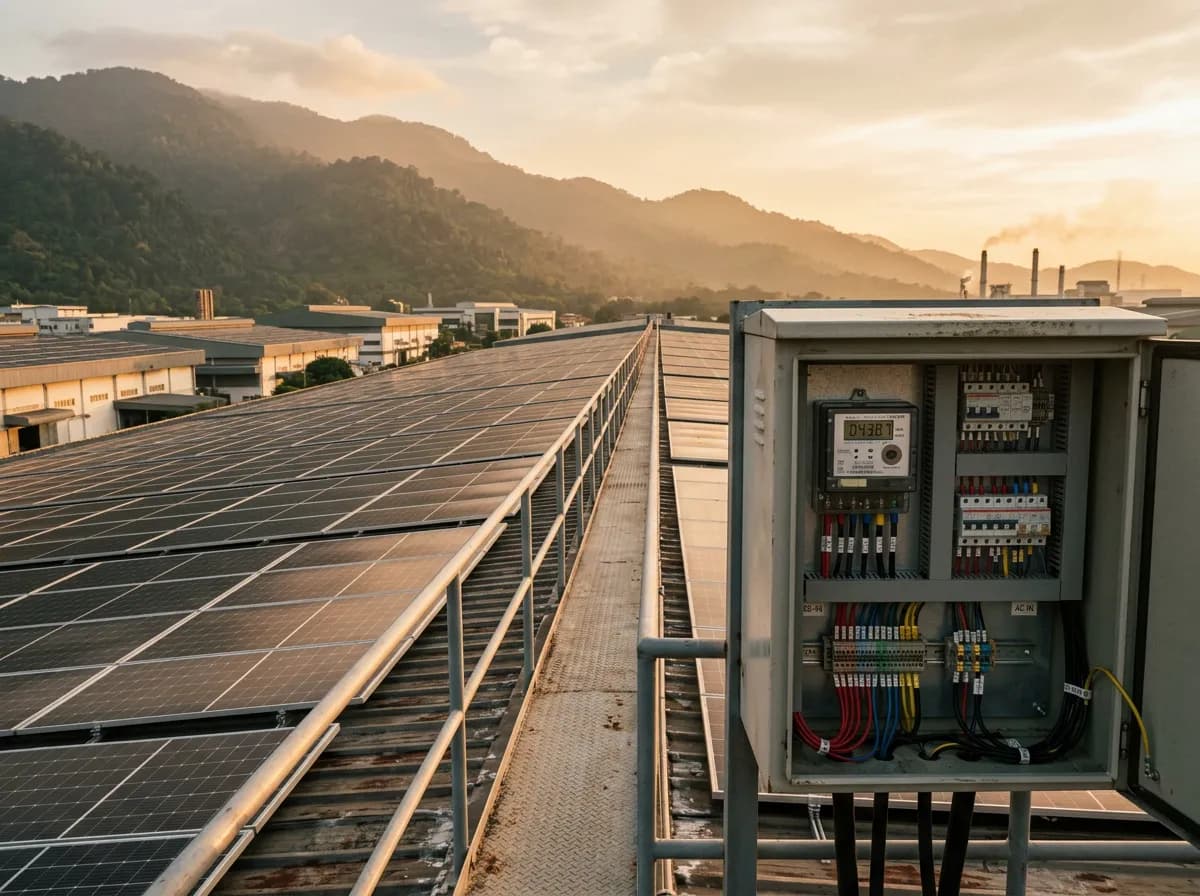
Customers, lenders and regulators increasingly ask for real emissions data. We meter where energy is actually used, then turn it into reports and savings you can act on.
Data that isn't kept or used
Records are scattered, overwritten or thrown away, so decisions run on gut feel.
Scope 2 this month
38.6 tCO₂e
5% lower than September
Sub-meters per building, line or machine, so you can see which equipment uses what and when.
Scope 1 and 2 emissions calculated from measured data, with the method documented.
Ready-to-share figures for customer questionnaires and the data behind Bursa Malaysia sustainability disclosures.
Spot equipment left running, peak-demand spikes and drift, and track what changes after you fix them.
A typical system, from where the data starts to where someone acts on it.
A typical first step: Meter your biggest energy users first, then build the baseline your carbon report needs.
With a baseline. We meter your largest loads, combine them with your bills, and give you a first measured picture to build on.
It gives them, and you, accurate data. We focus on measurement and reporting tools, and can work alongside your consultant.
Often. Seeing usage per machine and per hour usually reveals idle loads and demand peaks worth fixing.